Cheap, Small Cap, High Growth Stocks Experiment

Due to my young age (24) and hence limited time in industry to acquire venture capital, I am reliant on 3 main high-risk sources of income on the investment side to generate high percentage returns with small amounts of cash:
(1) High leverage real estate, or other high leverage investment methods utilizing low initial investments but high amounts of the public’s cash to generate high ROI.
+ Lowballing and risk taking into the fear of down markets for low acquisition prices in buyer’s markets.
(2) Small cap stocks.
(3) Trucking, oilfield, construction, or other similar high-risk, cyclical industries.

In the Spring of 2016 I decided to test the theory of selecting outperforming companies at bargain prices as the main premise, and then looking for those over-performers. That is, ranking companies according to ROC or ROA (return on capital, return on assets) and earnings yield or price-to-earnings ratio. Note this is loosely following the famous Magic Formula Investing philosophy of selecting outperforming companies at bargain prices.
I strive for ROC or ROA >=15%. Putting it into perspective: wouldn’t you just rather buy blue chips, real estate, or other common investments then for more common returns of <15%, rather than buying another piece of a business experiencing the same?
Then I aimed at companies specifically under $100 million market capitalization:
-
small enough still to have rapid room for growth
-
be attractive buyout/takeover candidates.
In order for a larger corporation to find interest in buying out a smaller one, the smaller one must be very undervalued given its potential, as the average buyout share price must be a lot higher than the current per-share price. Only so much shares are available at a time to buy at the current share price; to acquire more, the price must be bid up to attract sellers. The major shareholders especially, must be satisfied with their compensation.
-
draw not too much initial average investor attention to keep P/E ratios low and earning yields high.
Loosely I also applied other criteria:
- Earnings growth.
- Historic share performance (though very loosely).
- P/E ratio <10x, with some exceptions if still low relative to industry averages.
- Only going to the TSX Venture if no other worthwhile selection is available on TSX at the time.
So I then arrived at the following list as of March 28, 2016 and April 1, 2016, and their following respective prices 52 weeks later:
- CZO: $0.52 -> 1.42 (+173.0%)
- DMG: $0.18 -> 0.26 (+44.4%)
- TNA: $0.072 -> 0.104 (+44.4%)
- NVI: $0.083 -> 0.086 (+3.6%)
- PHO: $0.722 -> 0.855 (+18.4%)
- IGP: $0.638 -> 0.562 (-7.6%)
Average gain: +62.7% (with equal initial cash distribution to each)
If held to this time of writing (Jan. 12, 2018) without liquidation, the overall return is 97.1% – an average yearly return of 54.2%. The decline in returns can be explained by the decreasing earnings yields; higher costs for acquiring a stake in each company given a certain amount of its earning power.
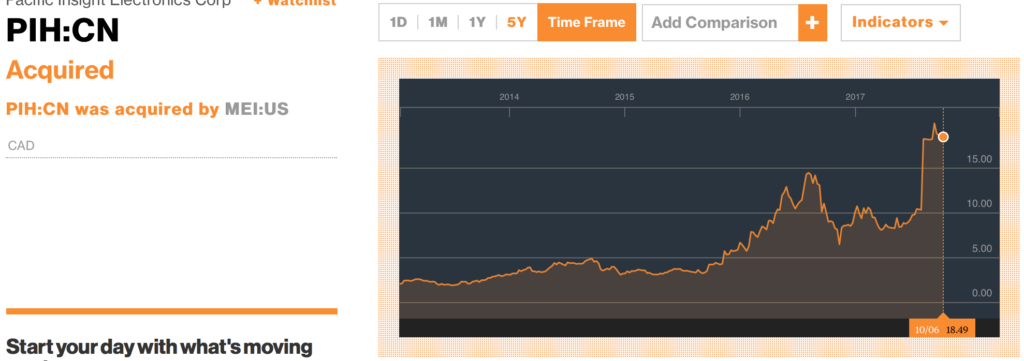
Now suppose we re-balance shares after the 1 year mark, to sell the now less undervalued companies to increase stakes in the still significantly undervalued ones. 52 weeks later, a new candidate PIH (Pacific Electronics Corp. – which is at this time of writing now bought out), is added to the undervalued list. One year is the usual time to take advantage of tax-loss selling if shares are acquired in January, and provides the market time absorb 4 quarters of positive information:
CZO, DMG, and TNA are all sold after 52 weeks. Cash goes to NVI, PHO, IGP, and PIH in equal amounts.
PIH: 1 + 1.405 lots
NVI: 1.036 + 1.405 lots
PHO: 1.184 + 1.405 lots
IGP: 0.924 + 1.405 lots
Total: 9.764 lots Apr. 3, 2017. (Started with 6 lots between 6 stocks)
1.036 represents +3.6% of the original 1 NVI lot, 1.184 represents +18.4% of the original 1 PHO lot, etc…
1.405 represents the average +87.3% gain experienced by CZO, DMG, TNA on average, now spread apart for the allocation between these 4 stocks.
From April 3, 2017 to this time of writing:
PIH: $8.33 -> 18.49 (+122.0%); 5.339 lots
NVI: $0.086 -> 0.14 (+62.8%); 3.974 lots
PHO: $0.855 -> 1.96 (+129.2%); 5.934 lots
IGP: $0.562 -> 1.55 (+175.8%); 6.423 lots
Total lots Jan. 12, 2018: 21.67 (9.764 April. 3, 2017)
Return Apr. 3, 2017 to Jan. 12, 2018: +121.9%
Return Apr. 1 2016 to Jan 12, 2018: +261.2%
Average yearly return: +152.9%
So we can conclude that the logic behind selecting companies generating high returns on their assets/capital, but are still obtainable at bargain prices, works- providing that rebalancing is done yearly or some other interval periodically, such as if a company suddenly becomes no longer a bargain relative to its peers. The gains are amplified under lower market capitalizations since these companies still have ample growth room, are attractive buyout candidates, and not yet draw enough average investor attention (or keep it around long enough due to their extreme volatile nature).
The problems with this study are:
- Low volume. The high risk nature is not in only the high variance experienced in stock prices, but in the illiquidity. For those without a time horizon of >=1 year, one may be forced to sell at significant losses. Sometimes one may have to hold for even longer if he/she is caught as a bag holder in a paper-loss position at the end of year 1.
- Small sample size for data, and very narrow selection. Very few stocks fit such criterion of being extremely low priced relative to its peers, and also experiencing high (15%+) ROA, ROC.
One may think bypassing the <$100M market capitalization and establishing a minimum volume requirement may improve returns, but from experience, this does not work with the above criteria tried so far. Higher market capitalization companies typically have less room for growth and have already inflated entry prices due to prudent investor attention. More investors are comfortable with them because they are not as hard to endure. In the longer term, technicals have little influence on performance; they are more critical for shorter term speculation. How a business does in the long run, is little influenced by the frequency and patterns its shares are traded in on a daily basis.
